Optimized Insurance Plans
Federal Poverty Level (FPL) Chart for 2027 Coverage
The full FPL chart by household size, with the 100%, 138%, 250% and 400% levels that decide what help you qualify for. Figures come straight from the federal guidelines.
Open Enrollment for 2027 coverage: November 1, 2026 – January 15, 2027. Enroll by December 15 to start coverage January 1.
Free 60-Second Eligibility Calculator
Enter your household size and expected annual income. You will see your percentage of the Federal Poverty Level and the help you are likely to qualify for. No email required.
What You Likely Qualify For
Where your income lands as a percentage of the Federal Poverty Level decides which kind of help you get. In plain terms:
Under 138%
You may qualify for Medicaid in expansion states, or for the largest ACA subsidies available. This is not a dead end. Talk to us and we will help you confirm it and look at all your options.
138% to 250%
You likely qualify for premium subsidies and cost-sharing reductions. This is the sweet spot: on a Silver plan your deductible and out-of-pocket costs come down as well as your premium. Most people in this range do not realise the second part exists.
250% to 400%
You likely qualify for premium tax credits that lower your monthly payment. Cost-sharing reductions stop at 250%.
Over 400%
You may still qualify for help if the benchmark plan where you live would cost more than 8.5% of your income. Worth checking rather than assuming.
Do not leave money on the table. Checking costs nothing and our brokers cost you nothing. The most common mistake we see is people assuming they earn too much to qualify.
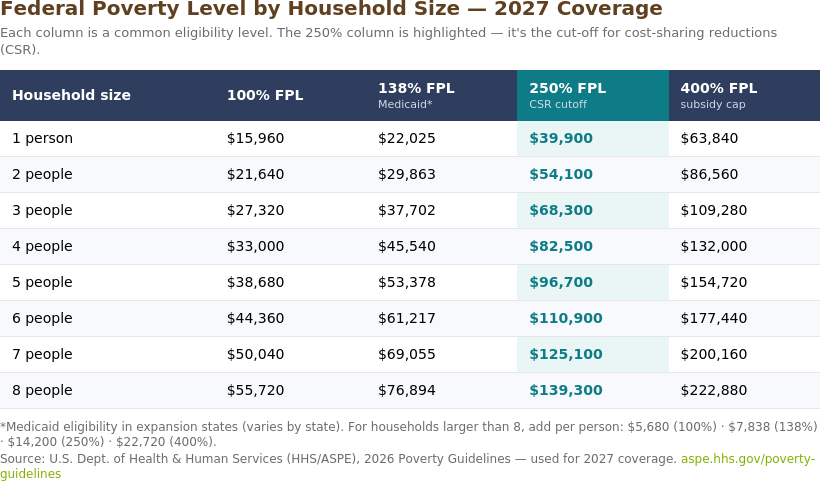
Federal Poverty Level by Household Size — 2027 Coverage
Each column is a common eligibility level. The 250% column is highlighted — it's the cut-off for cost-sharing reductions (CSR).
| Household size | 100% FPL | 138% FPL Medicaid* | 250% FPL CSR cutoff | 400% FPL subsidy cap |
|---|---|---|---|---|
| 1 person | $15,960 | $22,025 | $39,900 | $63,840 |
| 2 people | $21,640 | $29,863 | $54,100 | $86,560 |
| 3 people | $27,320 | $37,702 | $68,300 | $109,280 |
| 4 people | $33,000 | $45,540 | $82,500 | $132,000 |
| 5 people | $38,680 | $53,378 | $96,700 | $154,720 |
| 6 people | $44,360 | $61,217 | $110,900 | $177,440 |
| 7 people | $50,040 | $69,055 | $125,100 | $200,160 |
| 8 people | $55,720 | $76,894 | $139,300 | $222,880 |
*Medicaid eligibility in expansion states (varies by state). For households larger than 8, add per person: $5,680 (100%) · $7,838 (138%) · $14,200 (250%) · $22,720 (400%).
Source: U.S. Dept. of Health & Human Services (HHS/ASPE), 2026 Poverty Guidelines — used for 2027 coverage. aspe.hhs.gov/poverty-guidelines
Sources (all official U.S. government):
- HHS / ASPE, Federal Poverty Guidelines — aspe.hhs.gov/poverty-guidelines
- The exact 2026 table and computations — 2026 poverty guidelines computations
- Federal Register notice, 15 Jan 2026 — Annual Update of the HHS Poverty Guidelines
- ACA subsidies explained — HealthCare.gov, Federal Poverty Level (FPL)
Figures are the 2026 HHS poverty guidelines (48 contiguous states & D.C.), the guidelines used to score 2027 coverage. Alaska and Hawaii use higher guidelines.
Key Dates for 2027 Coverage
A June 2026 court ruling vacated the rule that would have ended Open Enrollment on December 15, so the full window through January 15 stands.
These dates vary by state. Several states run their own Marketplace on a longer window. Confirm the dates where you live, or ask us and we will confirm them for you.
Why the 250% FPL Threshold Matters
The Federal Poverty Level is a yearly income figure published by the federal government and used to decide who qualifies for help with health coverage. On its own it is just a number. What matters is where your income sits relative to it.
250% is the most valuable line on this chart. Below it, on a Silver plan, you receive cost-sharing reductions: a lower deductible, lower co-pays and a lower out-of-pocket maximum. Above it, the premium tax credit continues but the cost-sharing help stops. Two households a few thousand dollars apart can end up with very different deductibles on the same plan.
138% matters too. In states that expanded Medicaid, that line is roughly where Medicaid eligibility ends and Marketplace subsidies begin.
Every figure on this page comes straight from the published federal guidelines, linked above. Optimized Insurance Plans is a team of licensed insurance brokers. We are paid by the carrier, not by you.
Common Questions
Where do these numbers come from?
The U.S. Department of Health and Human Services publishes the poverty guidelines each January. The 2026 guidelines, published 15 January 2026, are the ones used to score 2027 coverage. Every source is linked above so you can check them yourself.
Why does this say 2027 coverage but 2026 guidelines?
That is correct, and it catches a lot of people out. Subsidies for a coverage year are calculated against the poverty guidelines published the year before. Open Enrollment starting 1 November 2026 sells 2027 coverage, scored against the 2026 guidelines.
Which income counts?
The Marketplace uses your estimated modified adjusted gross income for the coverage year, not last year's. Estimating it badly is the most common cause of owing money back at tax time, which is worth ten minutes with an agent.
Does it cost anything to talk to you?
No. There is no fee for our help and no obligation to enrol.
Do Not Miss the Deadline
Open Enrollment for 2027 coverage runs November 1, 2026 to January 15, 2027. Enroll by December 15 for coverage starting January 1. The two most expensive mistakes are guessing your income and missing the window.
A licensed Optimized Insurance Plans broker will check your exact subsidy, compare plans across carriers, and enroll you, at no cost to you.